
We have developed two ProForma Models expanding the Nine Numbers(R) systems model.
This decision model is based on an analysis of your marketing effort.
The other is based on your market share, and is available here.
You can download either or both of them to use in your business planning.
FINANCIAL PLANNING
ProForma Projections:
Looking Into the Future Based on
Your Marketing Effort
 |
View the Marketing ProForma |
Download the Marketing ProForma |
 |
This model assumes an on-going business, as the results are based on previous financial information you will provide. If you are a new business, you can input information about your new company based on what you intend to do and then adjust the information in the "What-If" section.
A segment of the systems diagram is shown next to the description. The entire diagram can be accessed by clicking on the link or the picture. It is worthwhile to study the diagrams to understand the relationships which exist in the model. The more you understand that "poking" here results in a "bulge" there, the more skilled you will become at managing your business and foreseeing the effects your management decisions will have.
The downloadable interactive spreadsheet will crunch your numbers and provide you with useful, actual forecasts for your planning and management efforts. An important aspect of the spreadsheets is the "What-If" section, which allows you to change the inputs and immediately see the effect on ProForma Profits. This section of each spreadsheet lets you see the effect of decisions you make to increase your advertising, change positioning of your company, increase salaries, decrease costs, and adjust several other variables.
Use the ProForma spreadsheet to see what next year could look like, and to develop benchmarks for future performance. Once you have adjusted the various inputs to what you think are realistic projections, use those numbers as goals to direct your thinking and planning for the coming month, quarter or year.
Let me know if this spreadsheet is useful for you, or if it should be modified to work better. I look forward to hearing from you.
ProForma based on Marketing Effort
(Click graphic for larger view)
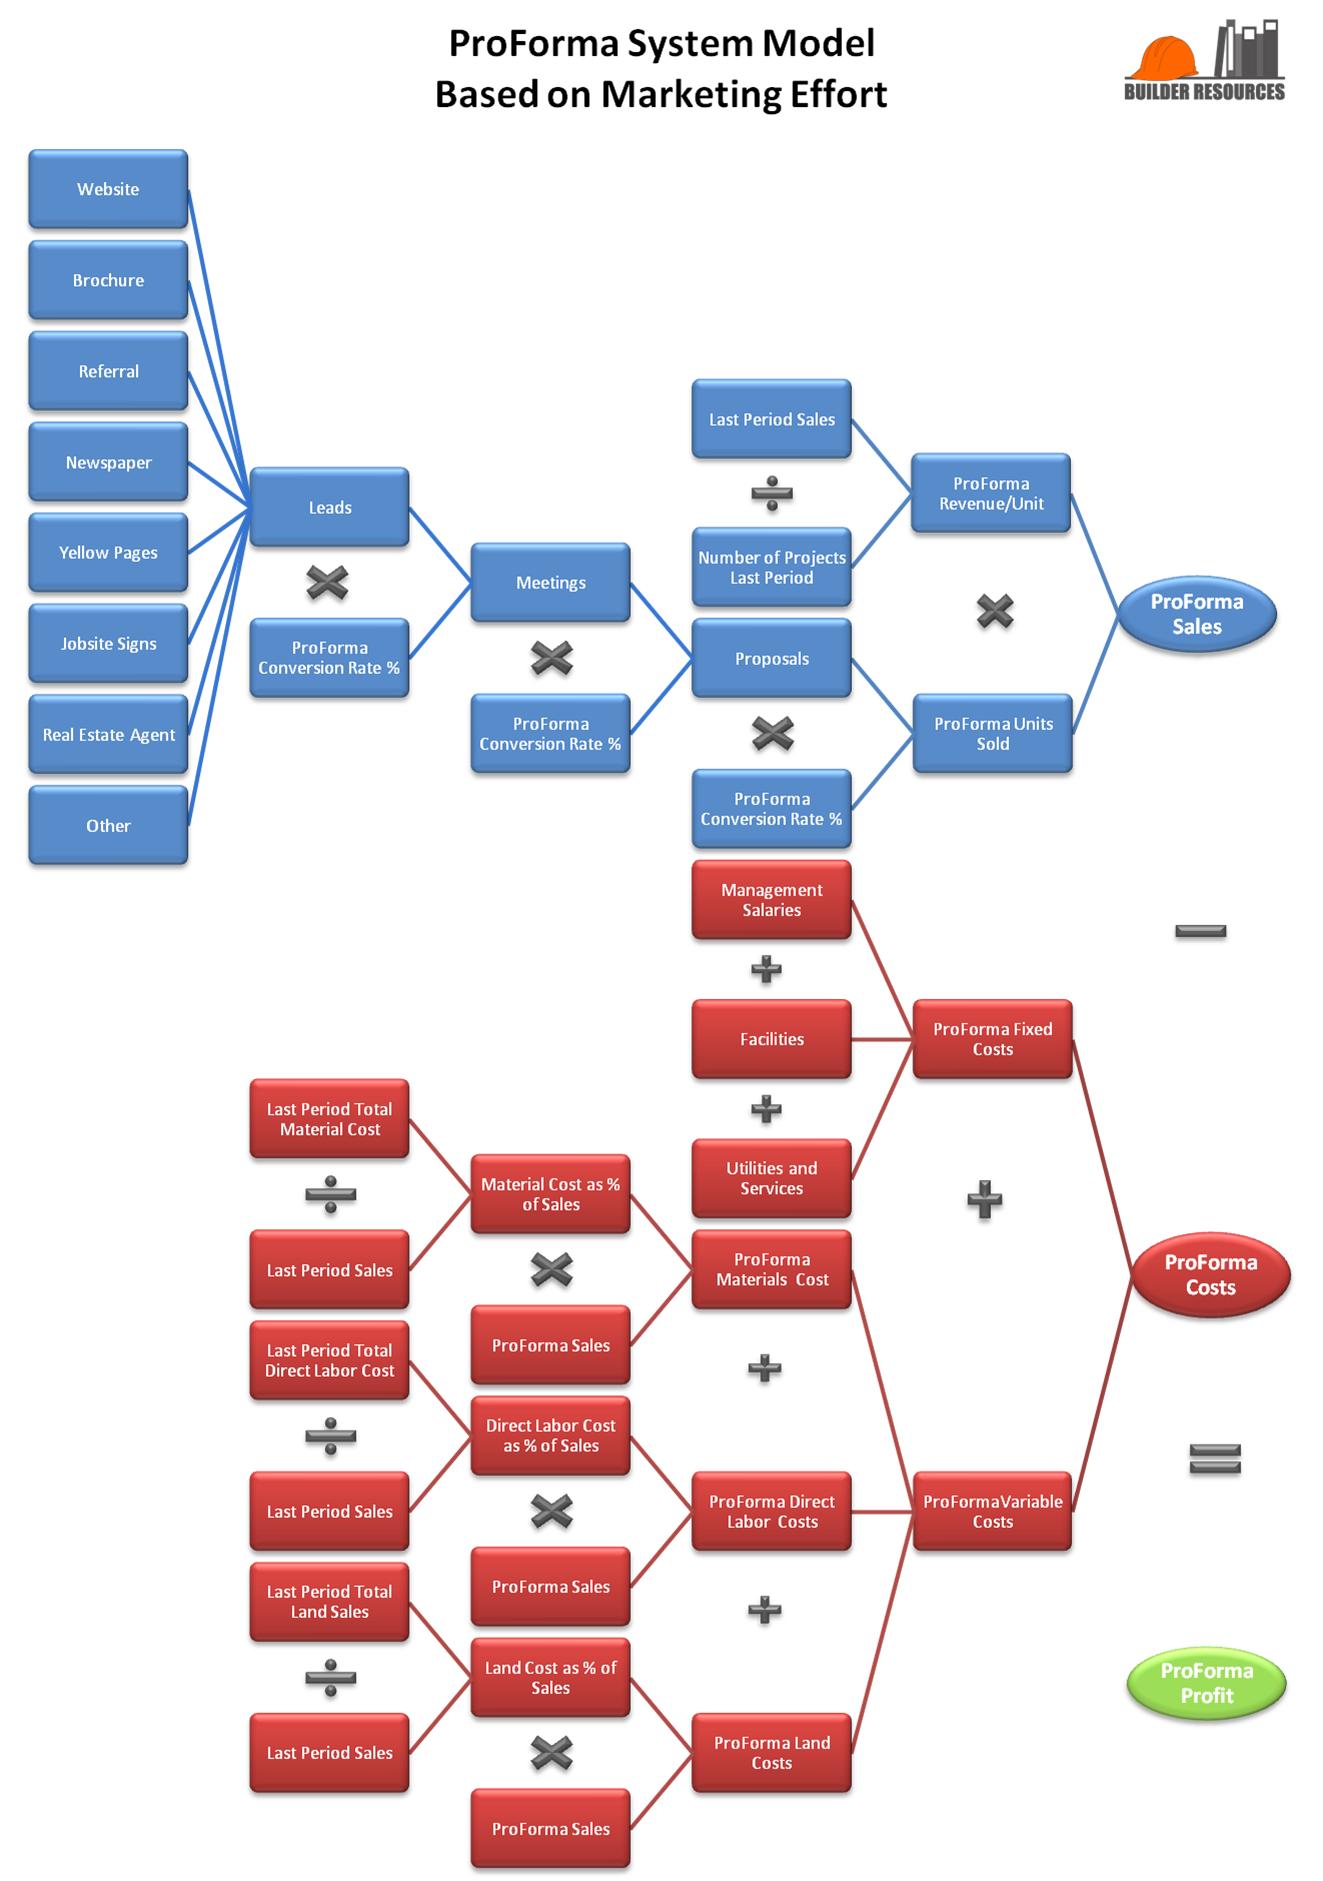
In this proforma model, we seek to forecast next period profits by looking at the productivity of the marketing efforts.
The diagram, a section of which is shown to the right, demonstrates the relationships of the various components of this system.
Each marketing initiative is listed and the expected number of leads generated by that initiative is noted. Those numbers are aggregated in Total Number of Leads Generated and then multiplied by proforma conversion rates for Meetings, Proposals, and, ultimately, Contracts. The proforma number of contracts is multiplied by Revenue Per Unit to produce the Expected Sales.
From this point, expenses are calculated based on a combination of past performance and future expectations. These fixed and variable Costs are subtracted from the projected Sales to produce the projected Profits for the period for which you are planning.

You can view and print a .PDF version of the schematic by clicking on the button to the right.
To view your actual results of these calculations, we have prepared an interactive Excel template for your use. The Marketing Profitability Template can be accessed by requesting it in the download form below. With a few inputs from you, this template will provide useful information as you plan your next period operations.
We have added a very useful component to this spreadsheet. The "What-If" analysis piece is meant to provide a look at the effect on future profitability of changing the inputs. You can answer questions such as "What if, by increasing the effectiveness of my niche marketing, I was able to generate more leads than I am expecting?" or "What if, by controlling my subcontractor cost better, I was able to decrease my Direct Labor Costs by 2%?" or "What-if, by understanding what my prospects are looking for in a house, I could increase my meeting conversion rate by 5%?".
Then, once you have generated the mix of Sales and Costs that provide the level of Profit you seek, the numbers should become your benchmarks for the next period.
To demonstrate, if you expect to have a meeting-to-proposal conversion rate of 40%, but find yourself falling below that mark, you will need to review your meeting performance and look at what you could be doing better.
Or, if you expect your materials costs to be at 37%, and find that the actual is at 42%, you will need to review your purchasing procedures to see what can be changed.
You can only improve what you can measure. This template will help you do that.
|
|
View the Marketing ProForma |
Download the Marketing ProForma |
|

Hint: For some help in analyzing your Total Market and your place in it, see the discussion of Market Positioning.
Good luck with this template. It can be a very powerful tool for planning and understanding your business.
Please let me know if the instructions are not clear, or if further instructions should be written. I want to make using this decision model as easy as possible.


 |
 |
 |
 |
 |
 |
 |
 |
 |
 |
 |
 |
| Copyright © Builder-Resources. All rights reserved. Used by permission. |
Builder-Resources.com Builder-Academy.com Builder-BOS.com |
Design by: |