OVERHEAD ALLOCATION
The Two Goals of Overhead Allocation
In the process of allocating Overhead Expenses to on-going projects, we want to accomplish two goals.
First, it is important that the allocations be reasonable. As an example of unreasonable allocations, imagine the following scenario. A construction business has just completed three large projects, and has signed contracts for three more large contracts, one to start in five weeks, one to start in seven weeks, and one to start in eight weeks. In the meantime, the company has one small project on-going.
In an allocation scenario which divides overhead costs for the month between the projects current in that month, it may be legitimate to load all the managerial, office, and support costs for the resources of the company, resources which were needed by the last three projects and will be needed again for the upcoming projects, onto the one small current project. But it is not reasonable. The additional burden placed on the current small job would make it appear very unprofitable, and skew the financial results of the large jobs, past and future, as well.
Second, the actual allocation process should result in the constant refinement of an Overhead Allocation Factor which is closer and closer to perfect. In the previous sections, we discussed the use of historical results by which the factor is established, and that in many cases the factor is established using historical data from the previous year. The two models being developed here make monthly adjustments to the Factor, and could easily be adapted to make even more regular adjustments.
The three previous sections covered a general discussion of:
 |
 |
 |
|
|
|
Overhead Allocation using Cost Of Goods Sold - COGS
|
View the Overhead Allocation Model based on Cost of Goods Sold ----> |
 |
Download the Overhead Allocation Model Based on Cost of Goods Sold ----> |
 |
First Month -
The first model we will address is a model based on Cost Of Goods Sold, and looks at the ratio between Direct Costs for an individual project and the total of all Direct costs for the period, in this case, for a month. Once that ratio is established, the ratio is applied to the Indirect, or Overhead Expenses, for the month. The rationale in this model is that we can expect the same ratio of Direct Expense to pertain for Indirect (Overhead) Expense.
The inputs required are the "Total Job Costs this Month", which can be found on the Income Statement, Cost of Goods Sold line item; "Total Overhead Costs this Month", which can be found on the Income Statement, Expenses line item; the "Job ID"; and the "Job Costs This Month", which is available from the Job Cost reports, if you are job-costing. (If you are not job-costing, allocating indirect expenses to the job level is a waste of time.) All the other analytical numbers are generated for you.
It should also be noted that the model shows analysis month by month for a twelve-month period. For demonstration purposes, I have taken the first month, the third month, the sixth month, and the twelfth month.
The monthly amount of Overhead Expense to be charged to the individual job is shown in the last column. That entry should be made in the General Ledger as shown and discussed in greater detail here.
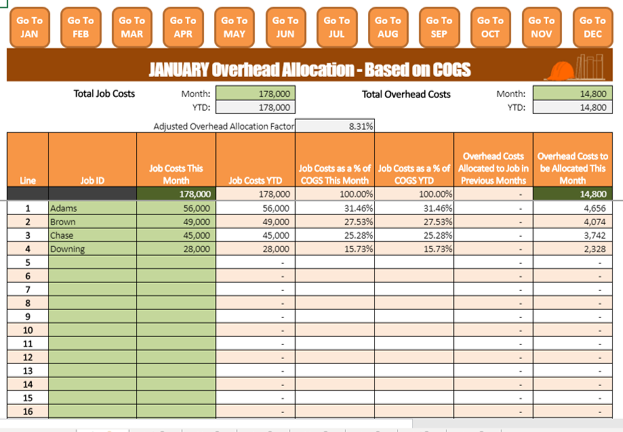
For example, in the illustration above and to the right, we have four jobs current. In the last month, a total of $178,000 was incurred in Direct Expenses for the four jobs. Job1 spent $56,000, or 31.46% of the total Direct Expenses for the month. Job2 spent $49,000, or 27.53% of the total Direct Expenses for the month. Job3 spent $45,000, or 25.28% of the total Direct Expenses for the month. Job4 spent $28,000, or 15.73% of the total Direct Expenses for the month.
To calculate the allocation of overhead expenses, you would multiply the total Overhead Expense of $14,800 by the percentage results in the previous step. Job1 would be allocated 31.46% x $14,800, or $4,656.18. Job2 would be allocated 27.53% of $14,800, or $4,074.16. And so on...
Third Month -

The entry procedure for each subsequent month is the same as the first month. Enter "Total Job Costs", "Total Overhead Costs", "Job ID", and "Job Costs This Month", and the model does the rest of the calculations.
The illustration to the right shows what the model looks like in the third month. The process is the same, but a couple of additional columns have been added. For tracking purposes, we have added a "Job Costs Year To Date (YTD)" column, "Job Costs as a % of COGS YTD" column, and a "Overhead Costs Allocated to Job in Previous Months" column.
The reason these columns have been inserted is that the model is "smoothing" the allocation numbers. That is to say, the model is constantly adjusting the direct cost figures to reflect each additional period, and the expenses attached to that period, recalculating the "Job Costs as a % of COGS", and multiplying the newly-calculated ratio by the total-to-date of Overhead Expenses. The effect of this is to smooth out unusual spikes and dips in monthly overhead costs by factoring in more iterations.
It is not imperative to understand the mechanics, as the results can be seen. Look at the first two jobs, 11-24 and 11-25. Even though those jobs have been completed and had no charges for the month, they are still adjusted in the final monthly calculations. Job 11-24 is credited $15.28 and Job 11-25 is credited $16.42 to adjust for the fact that the ratio of their direct costs to the Total Direct Costs changed during the month. Just for the record, the allocation amounts for completed jobs can increase or decrease each month, depending on the ongoing jobs.
Sixth Month -

Each month, the entries are made and the calculations run by the model. The resulting entries to the Overhead Allocation and Job Cost accounts are suggested by the model. In the model to the right, which is six months into the year, charges are added to completed accounts to adjust the current project balances, and defend against unreasonable job cost entries.
To understand the reason for this, look at the "Total Job Costs" for the month as it relates to "Total Overhead Costs". The ratio for this month is $18,200/$165,000 = 11.03%. In the Month Three chart above, the ratio was $17,000/$185,000 = 9.19%. Instead of loading the extra amount onto the three current jobs, the model smooths that unusual amount by recognizing that the previous jobs share the load.
Note also that the "Overhead Allocation Factor" is adjusting as the entries are made. In the first table it was at 8.31%, indicating that for every $100.00 of direct costs, you should add $8.31 of overhead load to your estimate. In the three-month table, that amount was adjusted to $9.23 per $100.00. In the six-month table, the amount is $10.42 per $100.00.
The model is attempting to ensure that the Overhead Factor is always indicative of the current load.
Twelfth Month -
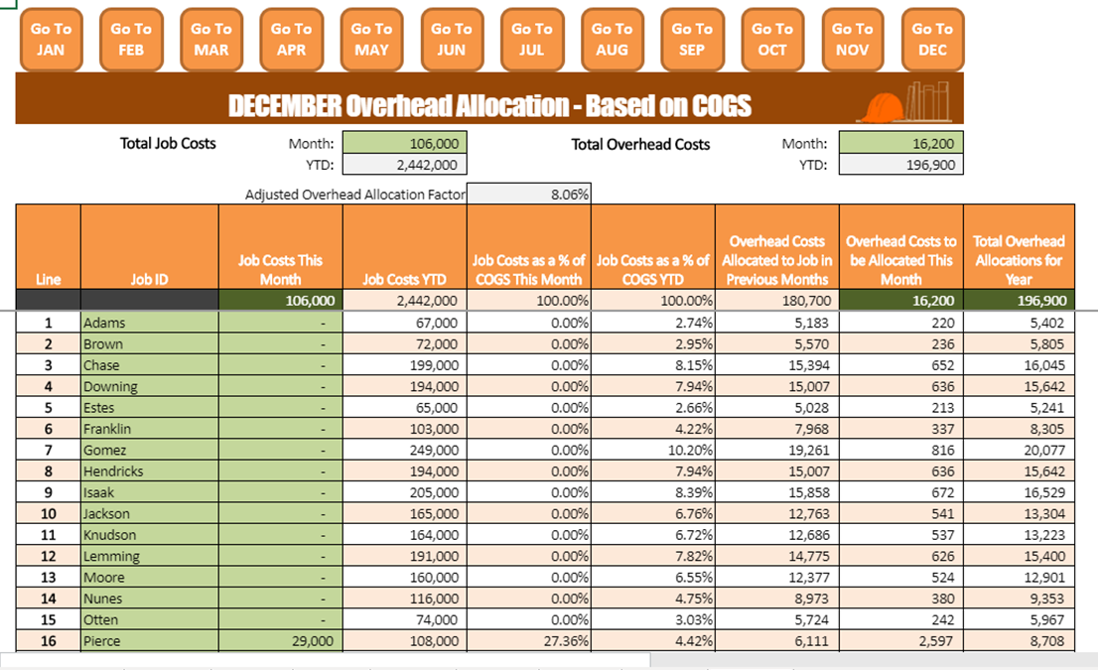
In the twelfth month, December in this model, we see a spike in the ratio between "Total Overhead Costs" and "Total Job Costs". That ratio is $16,200/$106,000 = 15.28%.
This jump in the overhead ratio is not an unusual circumstance, as the holidays reduce work days, the weather may shut down jobs, and employees go on vacation or are just generally less productive.
Recognizing that this is an unusual situation, the model factors costs back into previous jobs to spread the overhead load. The result is that you do not get a 15.28% Overhead Allocation Factor but an 8.06% factor to use in estimating. I have not included months 7-11 in this demonstration, but those months enjoyed a very beneficial relationship between the Total Job Cost and the Total Overhead Costs, suggesting that all assets were being used in a very productive way.
That is why, even though the December Overhead Allocation Factor was unacceptably high, we can recognize it as an aberration, and feel comfortable using the Overhead Allocation Factor suggested by the model at 8.06%.
The reason this is important is that using the current, smoothed 8.06% instead of the 15.28% from the December results means a reduction in overhead load on a $350,000 proposal of more than $23,000, which is more than sufficient to lose the project.
If we know that our real load over the course of the year is 8.06%, we should be comfortable using that number for our estimates.
Drawbacks and Limitations -
I wish I could say that the Smoothed Cost of Goods Model is the answer to the difficulty of Overhead Allocation. It provides some very useful information, and does appear to update the Overhead Allocation Factor in line with actual production.
However, it does have some drawbacks --
The Law of Large Numbers suggests that the more instances we have in our sample data, the better will be the results of our analysis. In this model, we are only dealing with twelve months, at the most. I think, if this model is adopted, that it would be useful to continue the analysis on an ongoing basis, without regard for the end of the year. The model could be easily adapted for that contingency.
The other drawback is the opposite side of the duration coin. If, for example, a new process were introduced into the production process which offered an enormous competitive advantage, the full effect of that advantage would take months to work its way into the analysis. While being able to price and win projects at an Overhead Allocation Factor which exceeds the reality is a good problem to have, it would still be important to know actual versus smoothed results in such a case. Having that knowledge would inform us about just how low we can go to win an especially attractive project.
Summary -
Still in all, the Overhead Allocation Model based on Cost of Goods Sold offers some major benefits for Job Cost Allocations -
- Two inputs per month, plus one for each existing and two for each new job.
- Y-T-D figures for Total Job Costs, Total Overhead Costs, and individual Job Cost Summaries.
- A constantly updated Overhead Allocation Factor.
- A smoothed Job Cost Allocation.
- Avoidance of misleading spikes and dips in Job Costs.
The download is available below. Use it and let me know what you think.
|
View the Overhead Allocation Model based on Cost of Goods Sold ----> |
|
Download the Overhead Allocation Model Based on Cost of Goods Sold ----> |
|
|
Return to ----> |
|

More about...


Related Topics

Budget Projections based on Marketing
Budget Projections based on Market Share
Overhead Allocation In the General Ledger
Overhead Allocation Cost of Goods Sold Model
Recent_Additions
-
Find Your Inner Geek - Content Marketing for the Builder
I've always advocated for hands-on control of your website marketing strategy. Here's one more reason. -
Design Phase - Charge or Don't Charge?
Two methods for handling the Design phase of the Design-Build process. And why I don't agree with one. -
Generational Preferences in Design - 2016
Knowing what your market niche is looking for in design features is critical to your success. Visit this chart to see what the different generations are expecting from you. -
Monitor Sub Insurance with Quickbooks
Keeping track of subcontractor insurances is just good risk management. Here is a video covering how to easily set up a tracking system in Quickbooks. -
Digitize Your Daily Progress Report Using Asana
The Daily Progress Report is a critical management tool for the Construction company. This video goes through how to use the Daily Progress Report in combination with the Asana Project Management temp… -
Why the Job Binder Is Better Than Drugs For A Good Night's Sleep
Go to the Job Binder Page to see this video about how to set up and use the Job Binder. Discover why using this system to archive ALL the information about a project could save you time, worry and mon… -
Five Financial Best Practices of Successful Construction Companies
The top construction companies succeed by doing the right things. A big part of success is using financial information to run their jobs and their companies. Read about their "best practices" here... -
Do The Math - Digging a Hole By Discounting
Discover the devastating effect on your business finances of offering a discount to get a job. You are not in business to lose money...are you? -
The Entrepreneurial Seizure
We've all had it happen...that's why we are where we are. Yesterday I couldn't even spell "entrepreneur", and today I am one. In this Podcast, discover how to become the best you can be at running a b… -
Your Marketing Checklist - Are you using these 35 steps?
This podcast covers 35 suggestions for increasing your business touchpoints with your market. How many are you using?
 |
 |
 |
 |
 |
 |
 |
 |
 |
|
 |
 |
| Copyright © Builder-Resources. All rights reserved. Used by permission. |
Builder-Resources.com Builder-Academy.com Builder-BOS.com |
Design by: |